It takes time to dive into reports on StockTrak, and ensure students are following up with their portfolios as they should. That is why we created our new Activity Report, available for Fall 2019 classes!
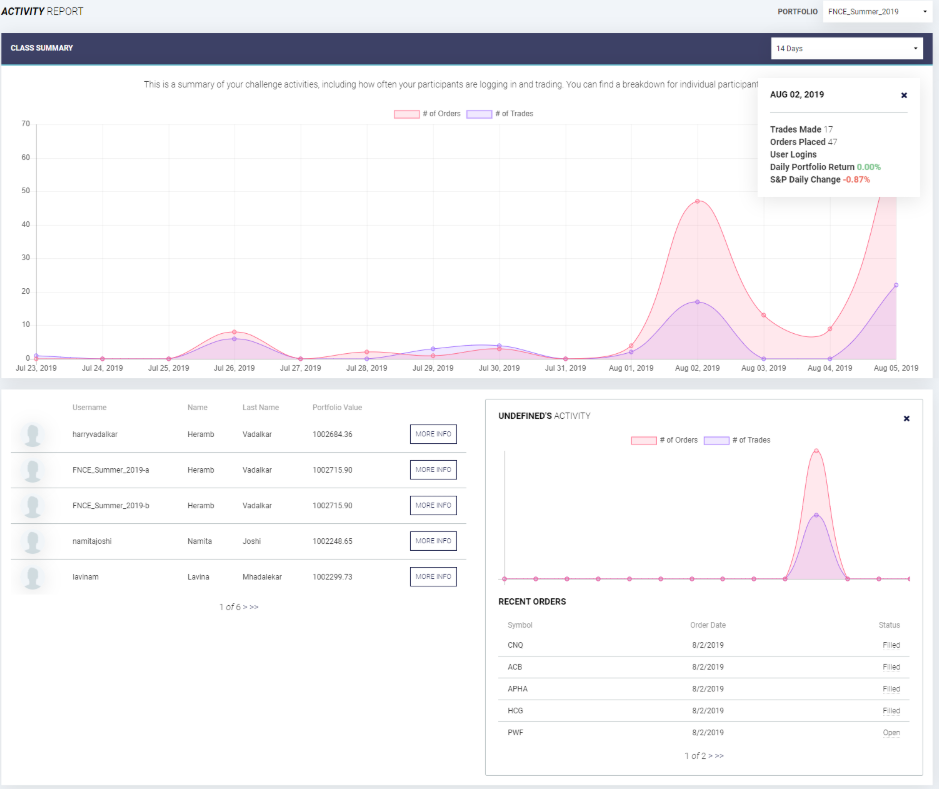
The new Activity Report shows an interactive graph of your class trading activity over the last 14 or 30 days, showing the breakdown of orders and trades by day, giving a crystal-clear view on how your students are interacting with their portfolios. We also let you dive down into each individual student’s activity, showing their daily activity, along with a summary of their most recent orders.
See our interactive preview of the new report, and click on any info point for more information.
Along with our new Diversification Reports and Custom Reports, it is easier than ever to manage your StockTrak classes. All three new reports can be found in the “Summary Reports” tab, under “Admin” on the main menu.
If you haven’t already, click here to register your classes for this semester!