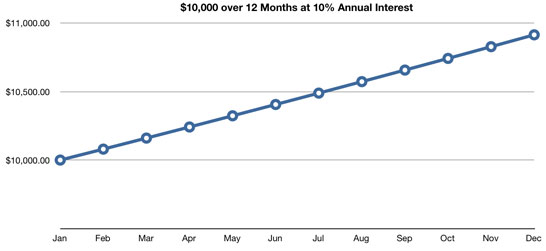
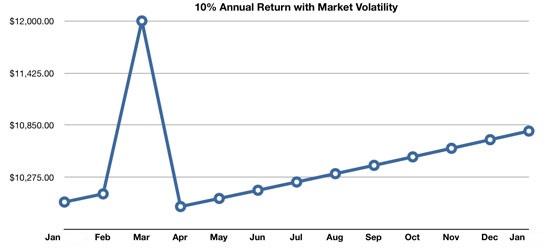
To measure your success of diversifying, several calculations have been developed to provide an indication of how well your portfolio is performing in terms of its variance and its return. There is more than 1 way to get a 10% return. Graph 1 below shows a smooth portfolio increase upwards at a 10% return over the year; graph 2 below shows a 10% return at year-end, but a real roller coaster of performance over the year.
Which portfolio would you rather have? The 2nd portfolio would be great if you sold out on March 1st and locked in your 20% return, but it sure didn’t hold that value for long. What if you had to sell out on April 1st and lost 5%?
To measure this relationship between a portfolio’s variance and its return, Wall Street has developed several ratios or indices. The most popular is also the simplest. It is called the Sharpe Ratio. Nobel prize winner, William Sharpe, created this formula over 40 years ago. The Sharpe Ratio informs you whether the higher returns you receive from certain securities are the product of your wonderful investing strategy or higher risk and volatility. This Ratio provides important feedback and helps you select the right stocks for you and your plan.

