Evaluating how students diversify their portfolios is one of the key concerns of most professors using StockTrak. Our new Diversification Report just made this a whole lot easier!
The new Diversification Report on StockTrak.com gives you a complete look at how students allocate their portfolios – both by security type and by industry.
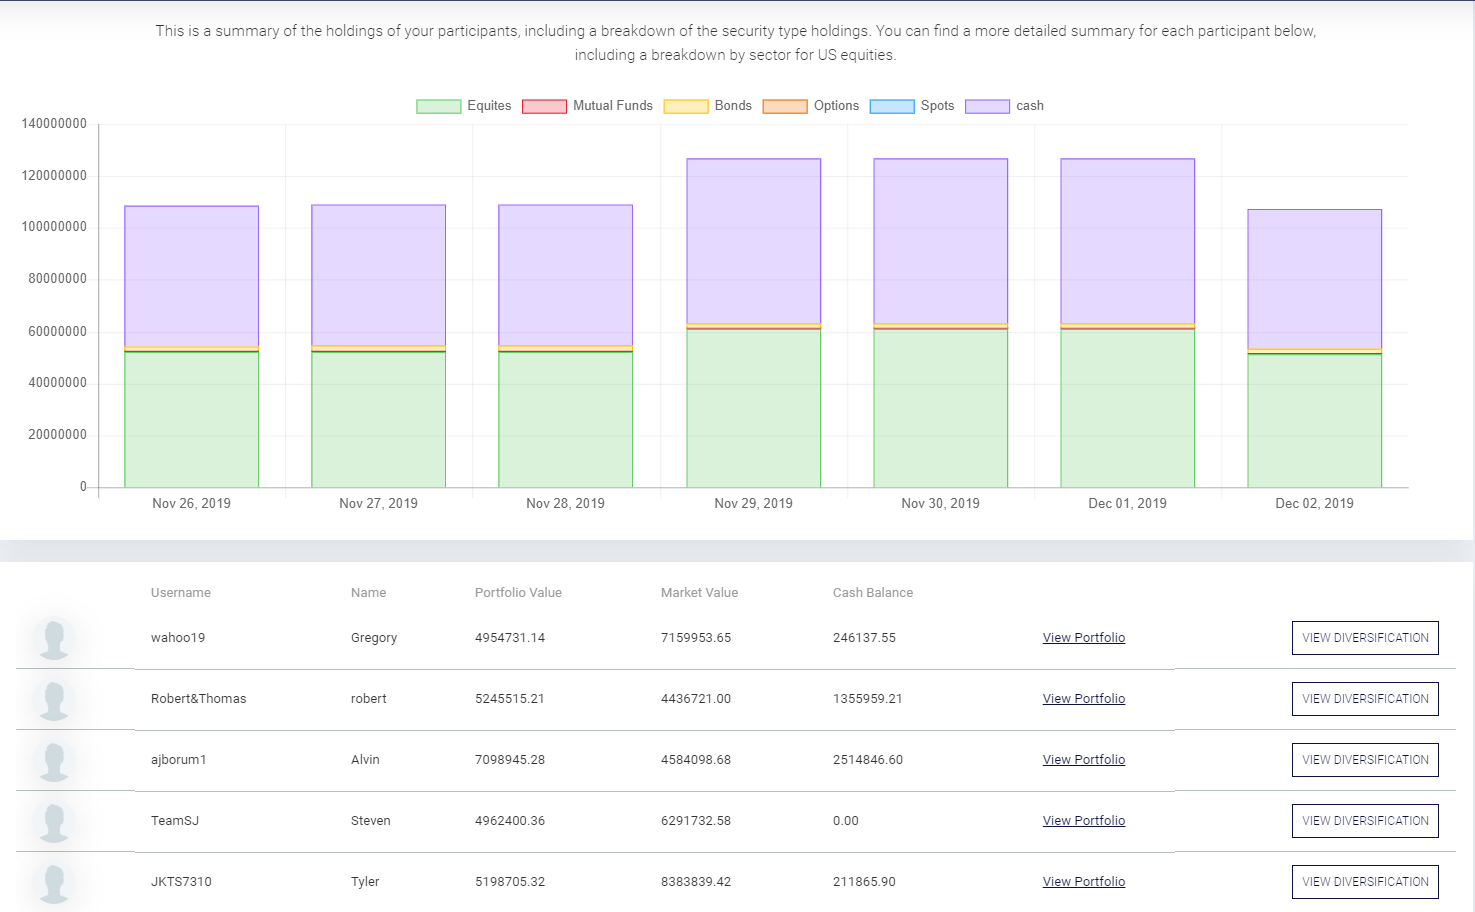
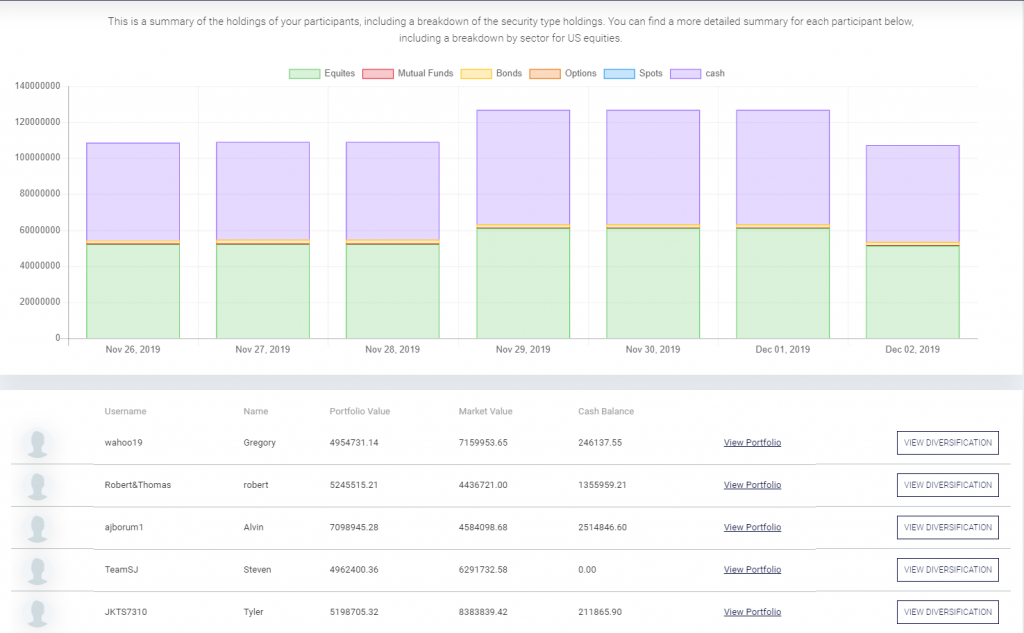
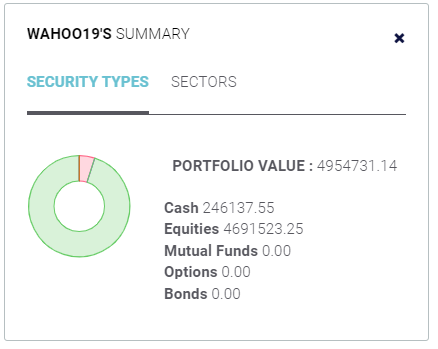
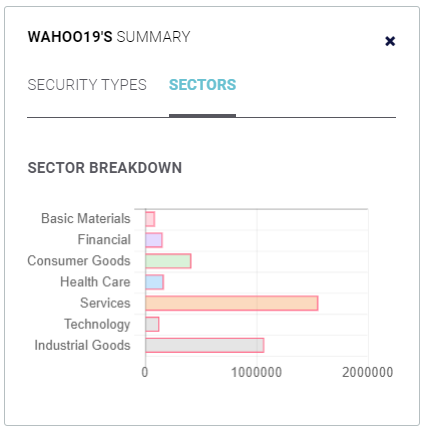
The top of the report shows your class summary for the last 7 days – the total market value of your entire class, broken down by asset type. The bottom lets you dive down into each student – a “View Portfolio” button to get a quick look at each student’s open positions and trades, along with a “View Diversification” button. This shows each student’s holdings – first with a pie chart showing breakdown by asset class, then with bar charts showing how their stock holdings break down by sector.
Due to the nature of the data, there are some limitations to this report:
- The breakdown by student is only based on their live open positions – not historical positions
- Futures, Future Options, and Forex holdings are excluded from the class summary
- Due to limitations of our data feed, sector breakdown data is only available for US equities
If you have any questions about taking advantage of this new report, let us know!
 5-07 Keep to Your Exit Strategies
 What is an ETF